Tuesday, February 25, 2014

Tuesday, February 18, 2014
Graphing Exponential Growth/Decay

- Graphing Exponential Growth/Decay
1. Create the Parent Graph.
2. Identify A,H,K.
3. Create your new T-Chart.
- Domain: All real #'s.
- Range: y>k; when a is positive. y<k; when a is negative.
- Asymptote: y=k.
4. Draw Asymptote.
5. Graph new points.

- Exponential Formula: y=a×bx-h+k
- a = multiplier.
0<a<1 = compression
a< 0(negative) = flipped over x-axis.
- b = base
0<b<1 = fraction; decay, always decreasing.
B is never negative only the multiplier is.
- h = lf/rt; opposite
- k = up/dn
General Forms of a Sequence
GENERAL FORMS OF A SEQUENCE
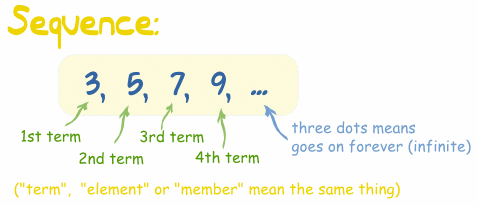
Geometric sequence formula- In a Geometric Sequence each term is found by multiplying the previous term by a constant. Also called the Common Ratio.

Example:
| 2, 4, 8, 16, 32, 64, 128, 256, ... |
This sequence has a factor of 2 between each number. Each term (except the first term) is found by multiplying the previous term by 2.
Finite sequence- Is a function with domain 1,2,3.Infinite sequence- Is a function with domain 1,2,3,4.... etc.
Series- Is the sum of a sequence.
Explicit formula- Each domain is an answer not based on any values.
Recursive Formula- Each domain is a answer based on a previous answer.
Wednesday, January 15, 2014
Characteristics and Traits of a Graph
The descriptions for each is posted below.
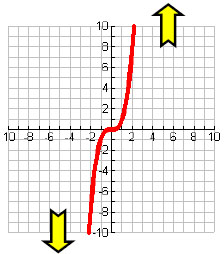 Domain- X-Values
Range- Y-Values
End Behavior- Describing the two ends of the graph. While X approaches negative infinity, Y approaches negative infinity. While X approaches positive infinity, Y approaches positive infinity and vice versa in another situation.
x→∞, y→∞. x→-∞,y→-∞
Absolute Max/Min- 1 point that has the highest/lowest point on a graph.
A specific point on the graph.
Local Max/Min- More than 1 point on a graph at its highest/lowest point.
Interval of Increase- Section of a graph where the y-values increase.
Interval of Decrease- Section of a graph where the y-values decrease.
 X-Intercept- Where the line(s) cross over the x-axis.
Y-Intercept- Where the line(s) cross over the y-axis.
Symmetry- Even/Odd/Neither
Even- The graph is symmetrical over the y-axis.
Odd- The graph is symmetrical about the origin.
Neither- The graph is not symmetrical at all.
Asymptotes- Imaginary line that the graph gets closer and closer too but never touches.
Function- The graph passes the vertical line test. The equation only has 1 x-value per y-value.
One to One- The graph pass the vertical and horizontal line test.
Subscribe to:
Posts (Atom)